Knowing when messages are being dead-lettered by Azure Service Bus queues is extremely important for monitoring of the overall health of a system that relies on ASB queues for message delivery and in-app or inter-app communication.
CloudMonix provides a number of ways to track and monitor for deadletter messages, each with its upsides and downsides. Any of these methods can be used together with others. Learn more about detailed information on what metrics are availble for monitoring Azure Service Bus here.
-
Capturing and tracking metrics of type AzureServiceBusDeadLetterMessageCount that track specific ASB queues. This approach is great for ASB namespaces with a small number of queues. Each AzureServiceBusDeadLetterMessageCount metric must point to an individual queue and can be individually alerted on or highlighted on the dashboard. The downside of using this metric is considerable amount of effort that must be spent on configuring it for every queue for an ASB namespace with many queues
-
Capturing and tracking metrics of type AzureServiceBusDeadLetterMessageCountBatch that track deadletters for a number of queues within ASB namespace. This approach is better for ASB namespaces with a larger amount of queues, especially of these queues follow a specific naming pattern that can be expressed via ODATA filter. Each AzureServiceBusDeadLetterMessageCountBatch metric captures deadletters from all queues in the namespace or just those that match an ODATA filter. Users are able to visualize deadletter charts overtime but are unable to know which specific queue contains deadletters than the AzureServiceBusDeadLetterMessageCountBatch metric tracks many queues internally
-
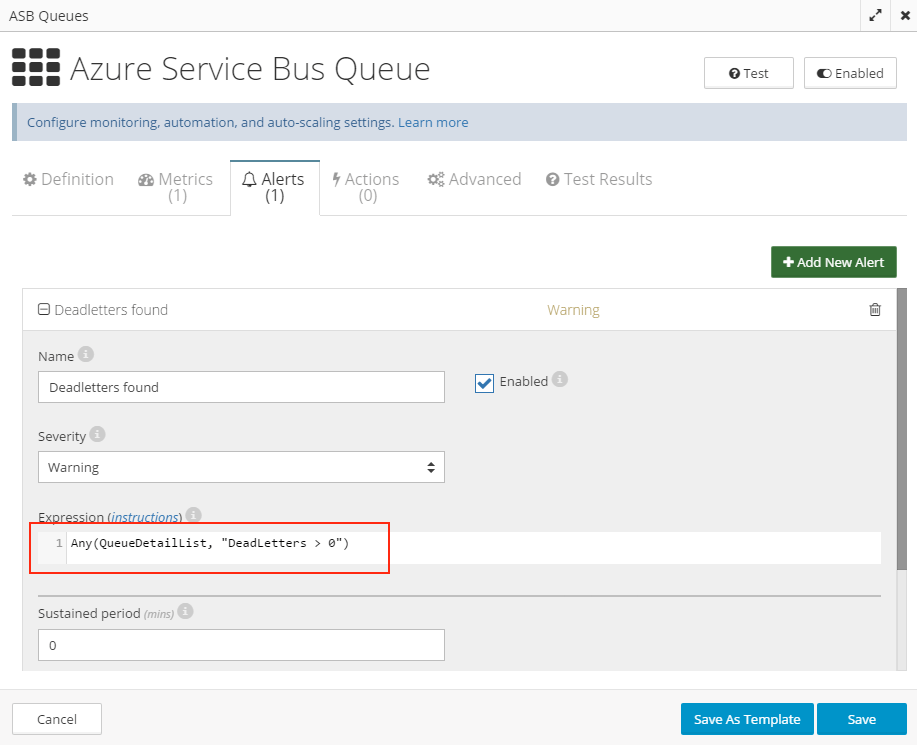
Capturing and tracking a metric of type AzureServiceBusQueueDetailsList. This metric allows for tracking of all (or some ODATA-filtered) queues within a single complex collection-based metric. Alert on when some queues in this metric contain deadletters can be accomplished with an alert that uses aggregate expression: Any(QueueDetailList, "DeadLetters > 0"). Users will know in the alert text which queue(s) caused the alert to fire. Downside of this metric is that it is not represented visually over time, but rather as a collection point-in-time. Furthermore, since this metric is not a numeric metric, data retention for this metric is approximately 30-60 days.
Creating an alert based on AzureServiceBusQueueDetailsList is simple. As of June 24th, 2015 this alert and metric are included in the default monitoring templates for Azure Service Bus

